2018 Results
Below are the results from a complete 1 year of data, from providing our clients with FW signals from the three stock markets in NYC.
Compiled from our hard data 1st January to 31st December 2018 Fractal Wave results delivered to you in a concise manner.
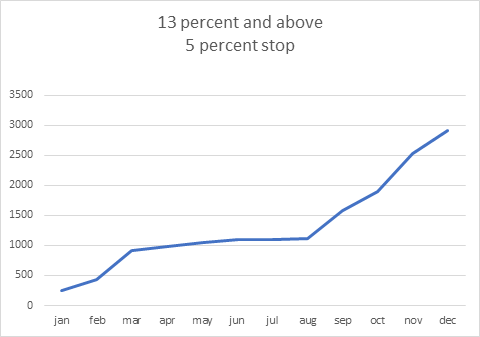
This first chart looks at the results for signals that had a minimum target of 13% or greater.
Signals in this category had the highest win rate percentage in 2018 of 73%.
FANTASTIC results.. and here they are – all backed up by hard facts and figures!

THE ABOVE CHART
assumes each signal with a 13% or higher target is entered
with $1,000 and held till either the target is reached,
or it is stopped out (exited) for a loss.
A 5% stop loss is assumed for each trade.
< < < 48 trades – 73 percent win rate > > >
If you chose only to take the trades with an expected win percent of 13 percent and higher in 2018,
you would have had an average of 4 trades per month.
The hypothetical returns in this case would be 58%,
without using leverage and assuming starting capital of $10,000.

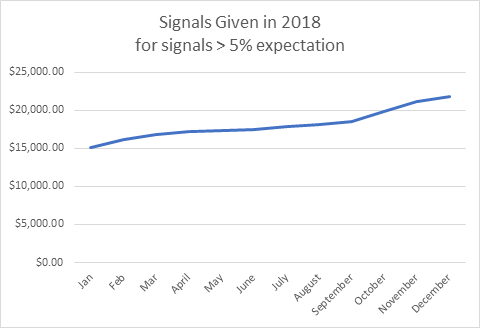
THE ABOVE CHART
assumes each signal with a 5% and higher target is entered
and held till either the target is reached,
or it is exited with a 5% stop loss
< < 314 trades – 61 percent win rate > >
There were 123 losers and 191 winners
Therefore a win/loss ratio if 60.8 %
These trades are simulated with a 1000-dollar investment per signal,
non compounded and the beginning capital was 15,000.
$6759 was made on these trades
$15,000 became $21,759
which is a
45 PERCENT return
If compounding your earnings and reinvesting monthly,
while using 2-1 leverage, expected returns are much higher.
If using 2-1 leverage, the expected return is
90 PERCENT

