Examples and Proof of Concept
Alpha Cycle signals
The following stocks have met the criteria for an Alpha Cycle Signal
|
Symbol
|
Possible Entry Price
|
Cycle Length
|
Expected Exit Date Time
|
Expected Exit Price
|
Expected Entry Date Time
|
Anticipated Move as % of Price
|
Trade Direction Long/ Short
|
|
ANH
|
4.8400
|
10
|
4/20/2018
|
4.6567
|
4/9/2018
|
3.79
|
short
|
|
CTSH
|
79.0700
|
15 |
4/27/2018
|
80.9471
|
4/9/2018
|
2.37
|
long
|
|
GME
|
13.4300
|
19
|
5/3/2018
|
12.0202
|
4/9/2018
|
10.5
|
short
|
|
NYCB
|
12.5600 |
5
|
4/13/2018
|
12.1343
|
4/9/2018
|
3.39
|
short
|
|
PSTG
|
18.4800
|
14 |
4/26/2018
|
19.6605
|
4/9/2018 |
6.39
|
long
|
| SCHN | 31.6000 | 7 | 4/17/2018 | 33.3127 | 4/9/2018 | 5.42 | long |
| TBT | 36.6100 | 6 | 4/16/2018 | 35.5910 | 4/9/2018 | 2.78 | short |
| TER | 42.6800 | 23 | 5/9/2018 | 45.8856 | 4/9/2018 | 7.51 | long |
| USO | 12.5100 | 6 | 4/16/2018 | 12.9280 | 4/9/2018 | 3.34 | long |
The Cycle Length tells us when to sell, which is the expected exit date, the cycle is based on trading days, not weekends.
Possible Entry Price is based on close price on day of signal, for example close of Jan 4th. You’d enter at or near open on January 5th, hoping to get the close price or better.
The exit price is based off of expected volatility during the cycle.
Potential IntraTrade Profit was how far the price went in our favor.
Net Profit is what we actually sold it at.
Potential Intratrade Draw Down was how far the trade went against us. We either hit the expected exit price during the swing, or we exit at end of cycle at whatever price is.
Direction And Length
Below is the way we determine the direction and length of trade. The dominant cycle is circled and it is a long with a cycle length of 10. All of that is determined from here. This is the signal for IRWD on Jan 4, 2017. This is just the initial signal; substantial work is done after to determine if this is a signal that we should consider.

Direction And Length
Below we can see the IRWD cycle and how it lines up with a normalized chart which is what the entrance would look like.

Direction And Length
And then below from the actual bar chart, the entrance and exit for IRWD with this signal.

Chart 1 shows an example of a short signal in ACXM, with an entry indicated at the first purple dot and the exit at the second. Again, both the entry and exit signals were given before the trade was entered.

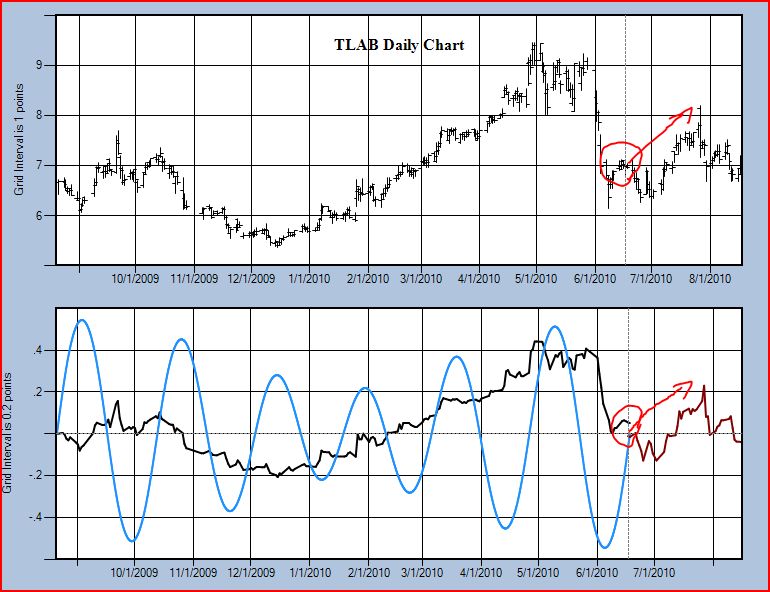
After the long entry signal shown for TLAB in Chart 2 (red circle), the stock went down first, held prior support, and then rallied to the target shortly thereafter. Note that once target was hit, as indicated by the Oscillator, TLAB then sold off. Too tight of a stop would be detrimental here, so it is important to have proper stops and funding.

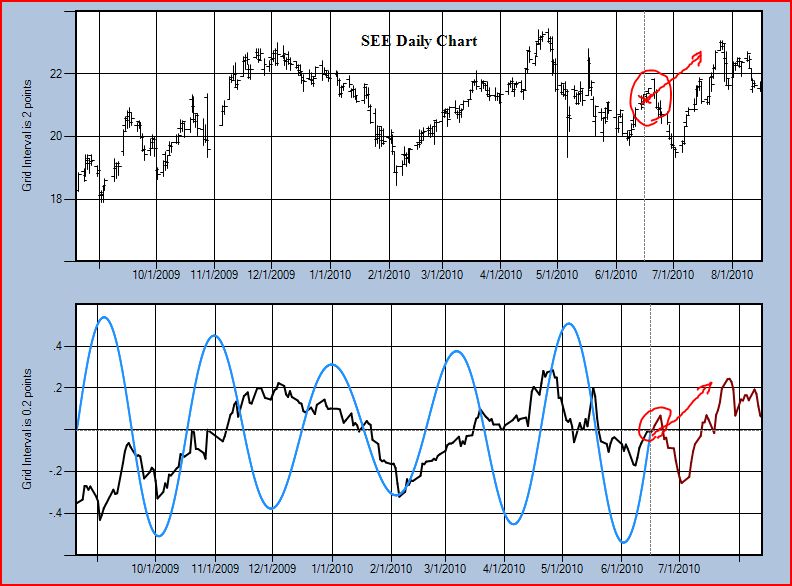
Again, in Chart 3, for SEE, we see a long entry (red circle) signal, followed by an initial sell off, but ultimately, the stock reached its target (tip of red arrow), before declining again.

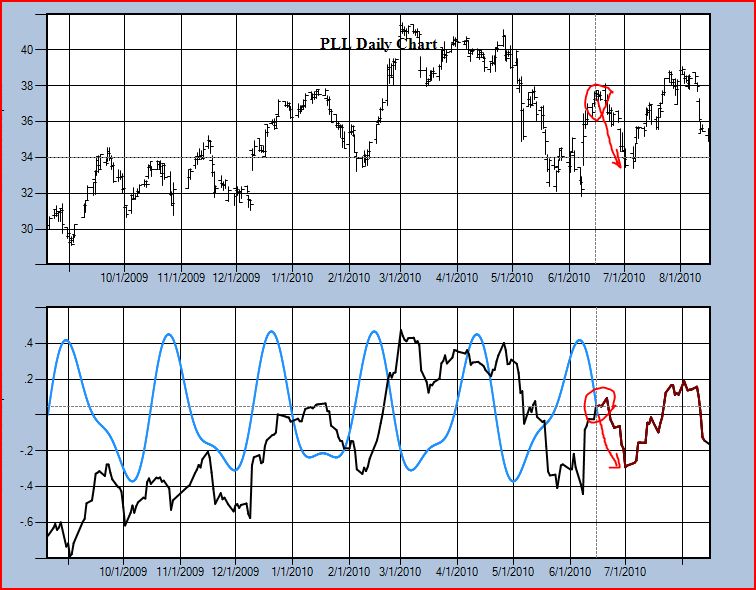
Chart 4 shows a short signal for PLL, where once again, when the target is hit, the stock quickly rallies, illustrating the significance of knowing the exit at the time of entry. It doesn’t always occur like that, but it happens enough times to make the Fractal Wave Oscillator a confident signal generator for a robust portfolio trading system. It will be an asset to anyone’s trading toolbox.


