2019 Results
Fractal Wave (FW) results for 2019 to December, 13, 2019
Below are the 2019 Fractal Wave hypothetical results from using signals for U.S. stock markets, to help provide some sense of signal/system validation.
Of course, subscribers will utilize the signals in a variety of ways according to their particular investing or trading plan.
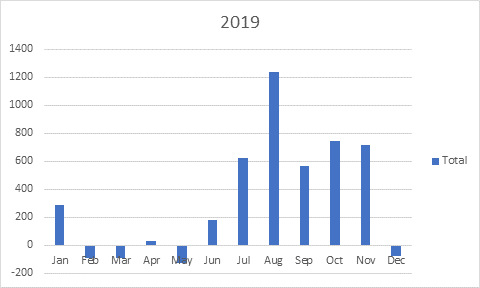
The first chart below shows hypothetical performance for signals taken that showed a potential profit of 3% and greater at time of signal. It is assumed that a $1,000 position was taken on each end-of-day signal at the open price the next trading day.

THE ABOVE CHART
Monthly Net Profit / Loss
Simulated $1000/per trade.
This is the monthly net profit or loss for trades closed during the specified month
– January of 2019 through Dec 13, 2019.
The chart assumes each signal with a 3% and higher target is entered
and held till either the target is reached, stopped out (exited) for a loss, or exited on the expiry date.
A 5% stop loss is assumed for each trade.
< < 315 trades total > >
There were 174 winners and 141 losers. Therefore, a win/loss ratio of 55.2 %
If compounding your earnings and reinvesting monthly, while using 2-1 leverage, expected returns could have been higher.
Commissions are not included in this analysis, neither is cost of Fractal Wave subscription

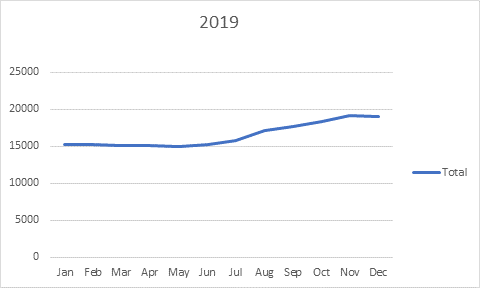
THE ABOVE CHART
Expanding on the above hypothetical,
this next chart is the
Cumulative Net Profit change over time
Starting with an account of $15,000.
Simulated $1000/trade.
All trades based on 3% minimum target and above
The cumulative profit over the time period
– January of 2019 through Dec 13, 2019.
$4005
would have been made on these trades
$15,000 becomes
$19,005
which is a 26.7% return

